Two-Way Basic Factorial Design II

Prof Randi Garcia
January 21, 2021

Reading contemplation question

  1. Sketch an interaction graph based on the set means (average daily weight gain) shown above. These factors are from the piglets example from your reading.
  2. Give an interpretation for this interaction.

Announcements

  • HW4 grades posted
  • HW5 due tonight at 11:55p
    • Please print or type your answers.
  • MP1 due on Tues 1/26 9:20a
    • Definitely let me know if you're having issues!
    • If you have over 30 responses, please delete your link on the sheet
  • Sign up for office hours here

Quiz 1 posted

  • Check Moodle
  • Due on Thurs Jan 28 11:55p
  • Open-book, open-notes, open-R, open-Google
  • Just like a problem set, but no help from Prof, no talking to each other

Agenda

  • Note on HW5 3b
  • Practice identifying designs
  • The BF[2] design continued

Homework 5 number 3b
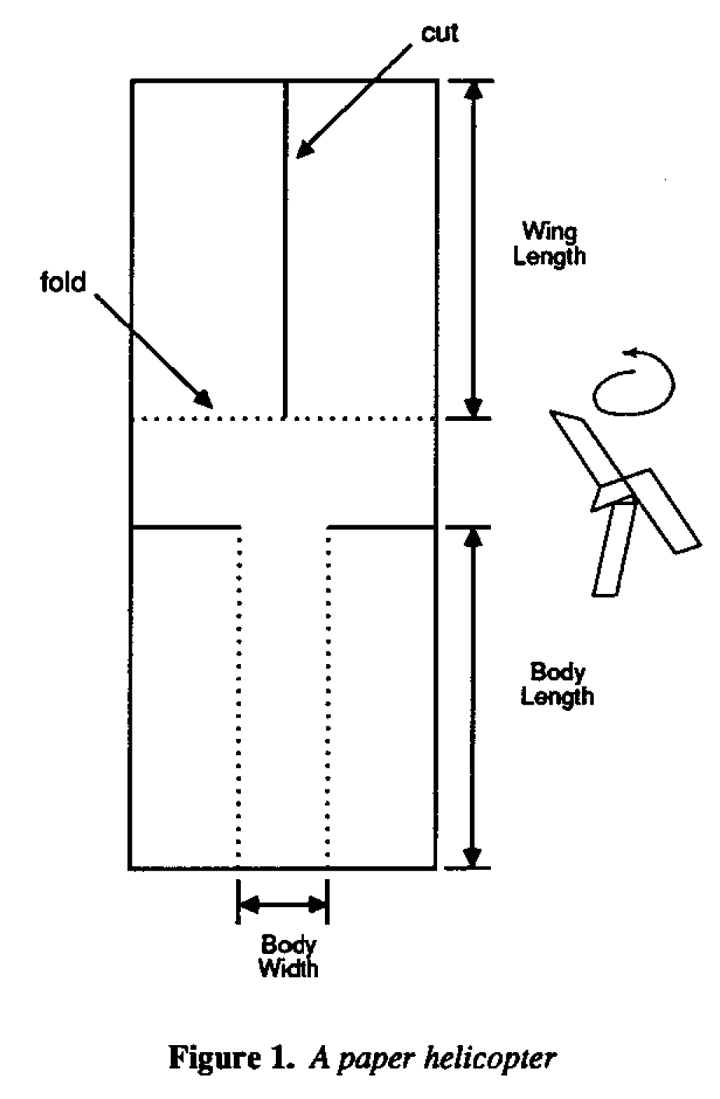
Paper Helicopters

Google slides

Paper helicopters can be cut from one half of an 8.5 by 11 sheet of paper. We can conduct an experiment by dropping helicopters from a fixed height and clocking the time it takes to drop. We can vary wing length: 4.25 in, 4.0 in, 3.75 in, and 3.5 in, as well as body width: 3.25 in, 3.75 in, 4.0 in, and 4.25 in. We'll make 32 planes and randomly assign them to the 16 combinations.

Addled Goose Eggs

The Canadian goose is a magnificent bird, but it can be a nuisance in urban areas in large numbers. One method of population control is to addle eggs in nests, but this method can hurt adult females because they continue sitting for too long. Would removal of the eggs at the usual hatch date prevent harm? It is suspected that females nesting together at different sites are similar to each other. We randomly select 5 different sites, and we then randomly assign 5 nests per site to the addle with no removal condition, and 5 nests per site to the addle plus removal condition. The females at the nests are banded such that survival age can be measured later.

Parks and Recreation

Deputy director of the Pawnee Parks and Rec department, Leslie Knope, needs to know how resistant different vegetative types are to trampling so that the number of visitors can be controlled in sensitive areas. Twenty lanes of a park are established, each .5 m wide and 1.5 m long. These twenty lanes are randomly assigned to five treatments: 0, 25, 75, 200, or 500 walking passes. Each pass consists of a 70-kg individual wearing boots, walking in a natural gait. One year after trampling, the average height of the vegetation along the lanes are measured.

Design Name Disambiguation

Basic Factorial, One-Way (BF[1])

  • The number in brackets is the number of factors
  • If the factor is a true experimental factor
    • Completely Randomized (CR[1]) Design or
    • Randomized Basic Factorial (RBF[1]) Design
  • If the factor is experimental OR observational
    • Basic Factorial (BF[1]) Design

ANOVA Source Table for BF[1]

  • Using algebraic Notation

\[ {y}_{ij}=\mu+{\alpha}_{i}+{e}_{ij} \]

\[ {H}_{0}:{\alpha}_{1}={\alpha}_{2}=...={\alpha}_{a} \]

Source SS df MS F
Treatment \( n\sum_{i=1}^{a}(\bar{y}_{i.}-\bar{y}_{..})^{2} \) \( a-1 \) \( \frac{{SS}_{Treatments}}{{df}_{Treatments}} \) \( \frac{{MS}_{Treatments}}{{MS}_{E}} \)
Error \( \sum_{i=1}^{a}\sum_{j=1}^{n}({y}_{ij}-\bar{y}_{i.})^{2} \) \( N-a \) \( \frac{{SS}_{E}}{{df}_{E}} \)

Critical-F and p-values for F-ratios

#Critical F for leafhoppers
qf(.95, 3, 4)
[1] 6.591382
#p-value for diet factor F-statistic
pf(17.67, 3, 4, lower.tail = FALSE)
[1] 0.009011571

BF[2] Inside-outside Factors and effect formulas

  • Draw the factor diagram vertically and label all inside and outside factors with arrows. Include the universal factors (benchmark and residuals).

BF[2] Design Formulas

\[ {y}_{ijk}={\mu}+{\alpha}_{i}+{\beta}_{j}+{\alpha\beta}_{ij}+{e}_{ijk} \]

  • Where \( i \), from 1 to \( a \), is the level of the first factor,
  • \( j \), from 1 to \( b \), is the level of the second factor,
  • and \( k \), from 1 to \( n \), is the observation in each cell.

Sum of Squares (SS)

\[ {SS}_{A} = \sum_{i=1}^{a}bn(\bar{y}_{i..}-\bar{y}_{…})^{2} \]

\[ {SS}_{B} = \sum_{j=1}^{b}an(\bar{y}_{.j.}-\bar{y}_{…})^{2} \]

\[ {SS}_{AB} = n\sum_{i=1}^{a}\sum_{j=1}^{b}(\bar{y}_{ij.}-\bar{y}_{i..}-\bar{y}_{.j.}+\bar{y}_{…})^{2} \]

\[ {SS}_{E} = \sum_{i=1}^{a}\sum_{j=1}^{b}\sum_{k=1}^{n}({y}_{ijk}-\bar{y}_{ij.})^{2} \]

Degrees of Freedom (df)

\[ {df}_{A}=a-1 \]

\[ {df}_{B}=b-1 \]

\[ {df}_{AB}=(a-1)(b-1) \]

\[ {df}_{E}=ab(n-1) \]

Mean Squares (MS)

\[ {MS}_{A}=\frac{{SS}_{A}}{{df}_{A}} \]

\[ {MS}_{B}=\frac{{SS}_{B}}{{df}_{B}} \]

\[ {MS}_{AB}=\frac{{SS}_{AB}}{{df}_{AB}} \]

\[ {MS}_{E}=\frac{{SS}_{E}}{{df}_{E}} \]

F-ratios and the F-distribution

The ultimate statistics we want to calculate is Variability in treatment effects/Variability in residuals. The F-ratio.

\[ F = \frac{{MS}_{A}}{{MS}_{E}} \]

\[ F = \frac{{MS}_{B}}{{MS}_{E}} \]

\[ F = \frac{{MS}_{AB}}{{MS}_{E}} \]

ANOVA Source Table for BF[2]

\[ {y}_{ijk}={\mu}+{\alpha}_{i}+{\beta}_{j}+{\alpha\beta}_{ij}+{e}_{ijk} \]

Source SS df MS F
Treatment A \( \sum_{i=1}^{a}bn(\bar{y}_{i..}-\bar{y}_{…})^{2} \) \( a-1 \) \( \frac{{SS}_{A}}{{df}_{A}} \) \( \frac{{MS}_{A}}{{MS}_{E}} \)
Treatment B \( \sum_{j=1}^{b}an(\bar{y}_{.j.}-\bar{y}_{…})^{2} \) \( b-1 \) \( \frac{{SS}_{B}}{{df}_{B}} \) \( \frac{{MS}_{B}}{{MS}_{E}} \)
Interaction AB \( n\sum_{i=1}^{a}\sum_{j=1}^{b}(\bar{y}_{ij.}-\bar{y}_{i..}-\bar{y}_{.j.}+\bar{y}_{…})^{2} \) \( (a-1)(b-1) \) \( \frac{{SS}_{AB}}{{df}_{AB}} \) \( \frac{{MS}_{AB}}{{MS}_{E}} \)
Error \( \sum_{i=1}^{a}\sum_{j=1}^{b}\sum_{k=1}^{n}({y}_{ijk}-\bar{y}_{ij.})^{2} \) \( ab(n-1) \) \( \frac{{SS}_{E}}{{df}_{E}} \)

Interaction Graphs

For each of the following interaction graphs, answer the following questions with YES or NO.

  1. Is there a main effect of B12?
  2. Is there a main effect of antibiotics?
  3. Is there an interaction between B12 and antibiotics?

Practice 3

plot of chunk unnamed-chunk-3

Practice 3

plot of chunk unnamed-chunk-4

  1. YES
  2. YES
  3. NO

Practice 4

plot of chunk unnamed-chunk-5

Practice 4

plot of chunk unnamed-chunk-6

  1. NO
  2. YES
  3. NO

BF[2] in R

Teaching Methods

A professor wanted to compare three different teaching methods to determine how students would perceive the course: 1) instructionist, 2) inquiry-based, and 3) team-based. She randomly assigned the same class (same topic different students) from 6 different semesters to treatments. At the end of the semester students were asked to rate the course on a 5-point scale, and the average class rating was calculated.

Anxiety and Memory

A psychologist wants to study the effect of anxiety on 4 different types of memory. Twelve participants are assigned to one of two anxiety conditions: 1) low anxiety group is told that they will be awarded $5 for participation and $10 if they remember sufficiently accurately, and 2) high anxiety group is told they will be awarded $5 for participation and $100 if they remember sufficiently accurately. All subjects perform four memory trials in random order, testing 4 different types of memory. The number of errors on each trial is recorded.