Four Desgins

Prof Randi Garcia, SDS 290

2024-10-02

Announcements

  • Working on HW3 grades
  • HW4 due on Friday
  • Office hours (Bass 412)
    • Friday office hours cancelled
    • By appointment
  • Where to get HW help
    • Spinelli center tutoring Sun-Thurs 7-9p, Sabin-Reed 301. Nora Z, Cindy, and Sarah can help with 290.
    • Post questions to hw4-questions Slack channel.

Agenda

  • Warm up
  • Four designs
  • MP1 time

Warm-up: Walking Babies Example

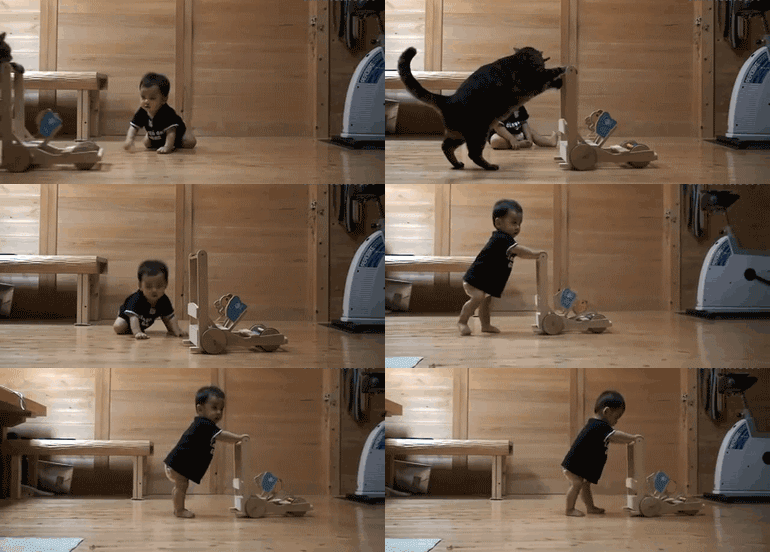
As a rule it takes about a year before a baby takes its first steps alone. Scientists wondered if they could get babies to walk sooner by prescribing a set of special exercises. They decided to compare babies given special exercises with a control group of babies. But the scientists recognized that just showing an interest in the babies and their parents could cause a placebo effect. That is, the attention alone could influence parents and their babies in ways that would shorten the time to walk. 24 babies were randomly assigned to one of four conditions:

  1. Special exercises: Shown special exercises and parents are called weekly and asked it their baby was walking.
  2. Exercise control: No special exercises but parents were told to have baby exercise for 15 min every day. Parents were called each week.
  3. Weekly report: No exercises but parents were called each week.
  4. Final report: Only a report at the end on the study.

They recorded the age (in months) the babies first walked.

Warm-up: Walking Babies Example

data("WalkingBabies")
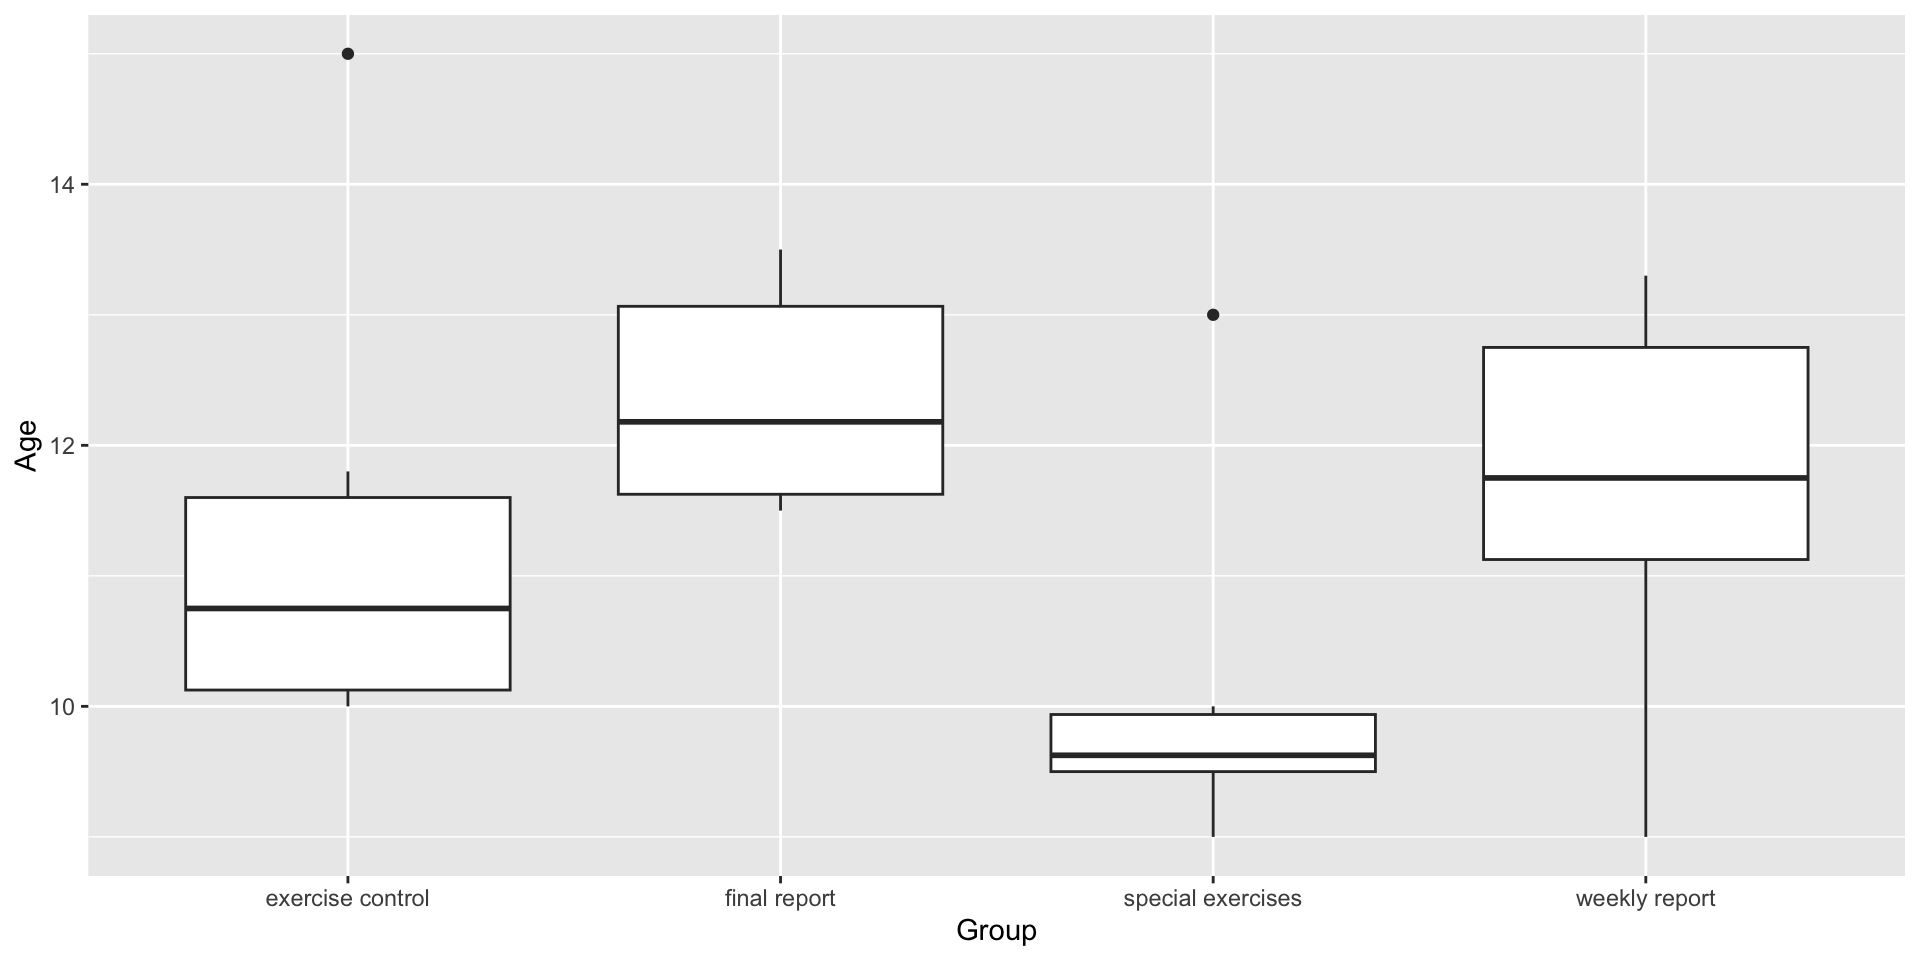
qplot(x = Group, y = Age, data = WalkingBabies, geom = "boxplot")

Conduct an ANOVA to test if there are mean differences in walking age between treatments. Check the ANOVA conditions (SINZ only). What do you conclude?

Warm-up: Walking Babies Example

data("WalkingBabies")
qplot(x = Group, y = Age, data = WalkingBabies, geom = "boxplot")

Warm-up: Walking Babies Example

WalkingBabies %>%
  group_by(Group) %>%
  summarise(n = n(),
            m = mean(Age),
            sd = sd(Age))
# A tibble: 4 × 4
  Group                 n     m    sd
  <fct>             <int> <dbl> <dbl>
1 exercise control      6  11.4 1.90 
2 final report          6  12.4 0.871
3 special exercises     6  10.1 1.45 
4 weekly report         6  11.6 1.56 
1.90/0.871
[1] 2.181401

S: No…but could be worse. I: babies are in different families.

Warm-up: Walking Babies Example

babyMod <- lm(Age ~ Group, data = WalkingBabies)
anova(babyMod)
Analysis of Variance Table

Response: Age
          Df Sum Sq Mean Sq F value Pr(>F)
Group      3 15.597  5.1991  2.3418 0.1039
Residuals 20 44.402  2.2201               

Warm-up: Walking Babies Example

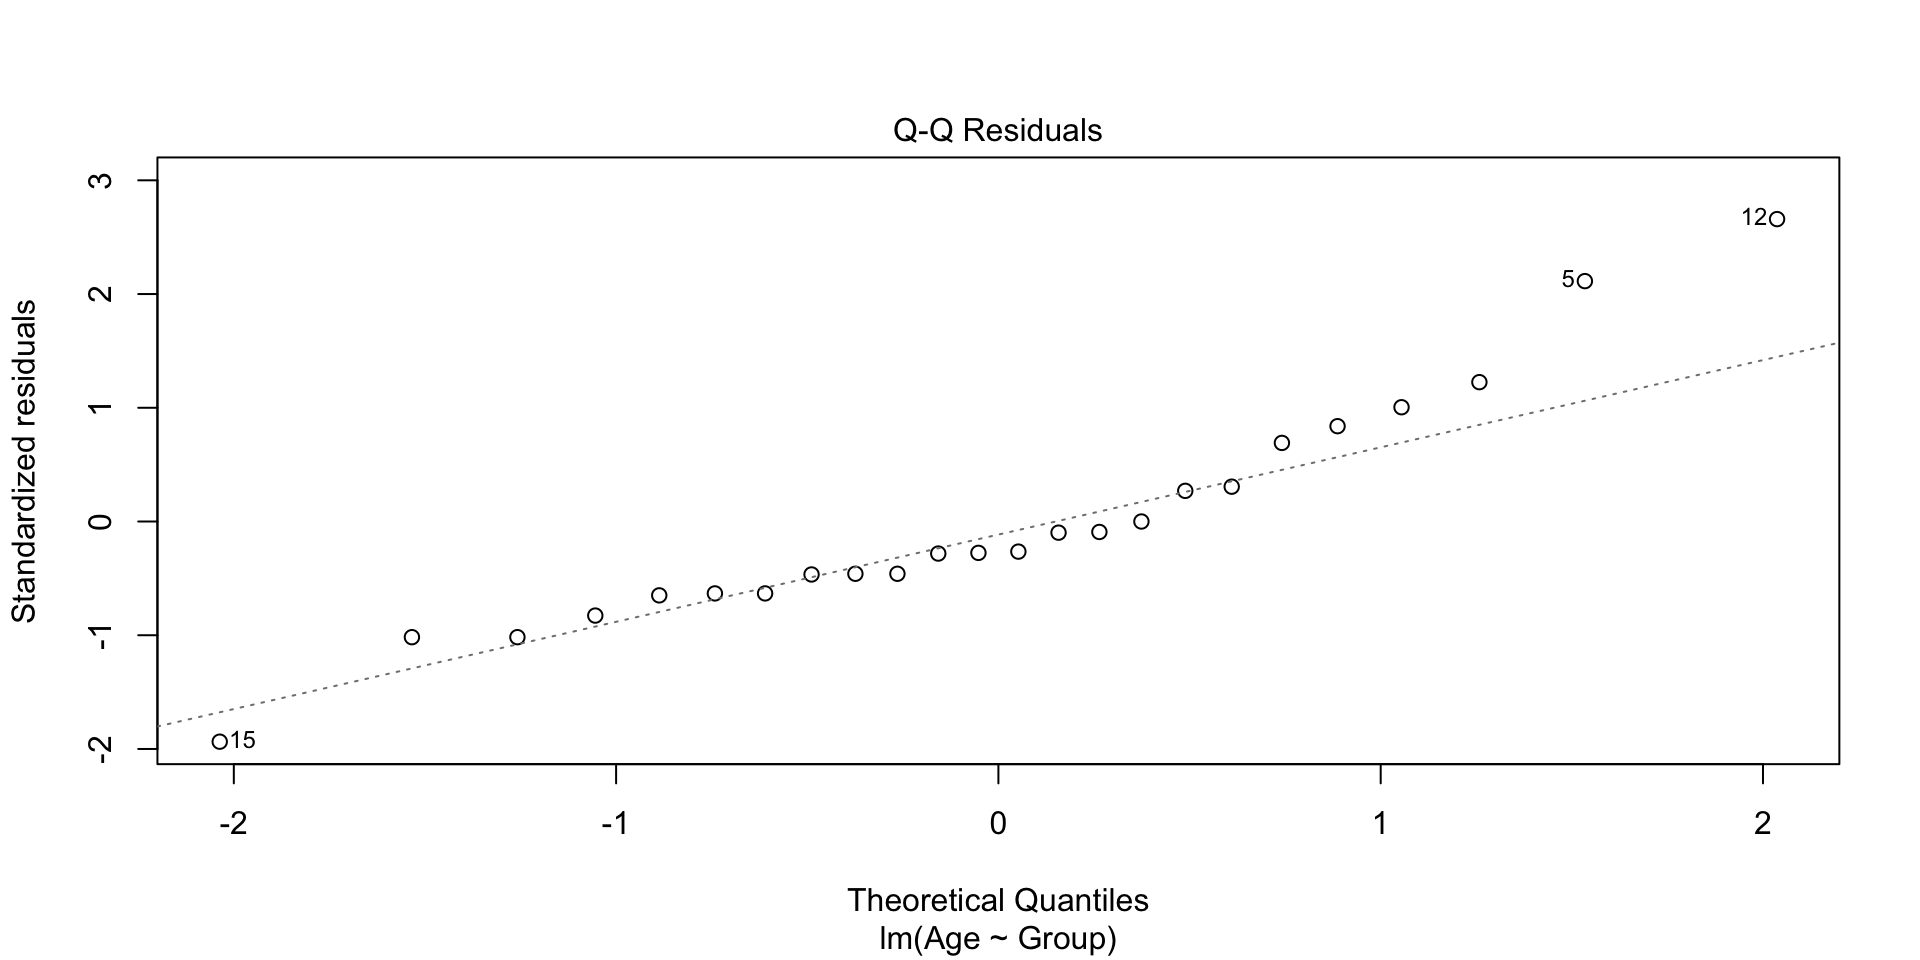
plot(babyMod, which = 2)

N: looks ok with possible skew

Warm-up: Walking Babies Example

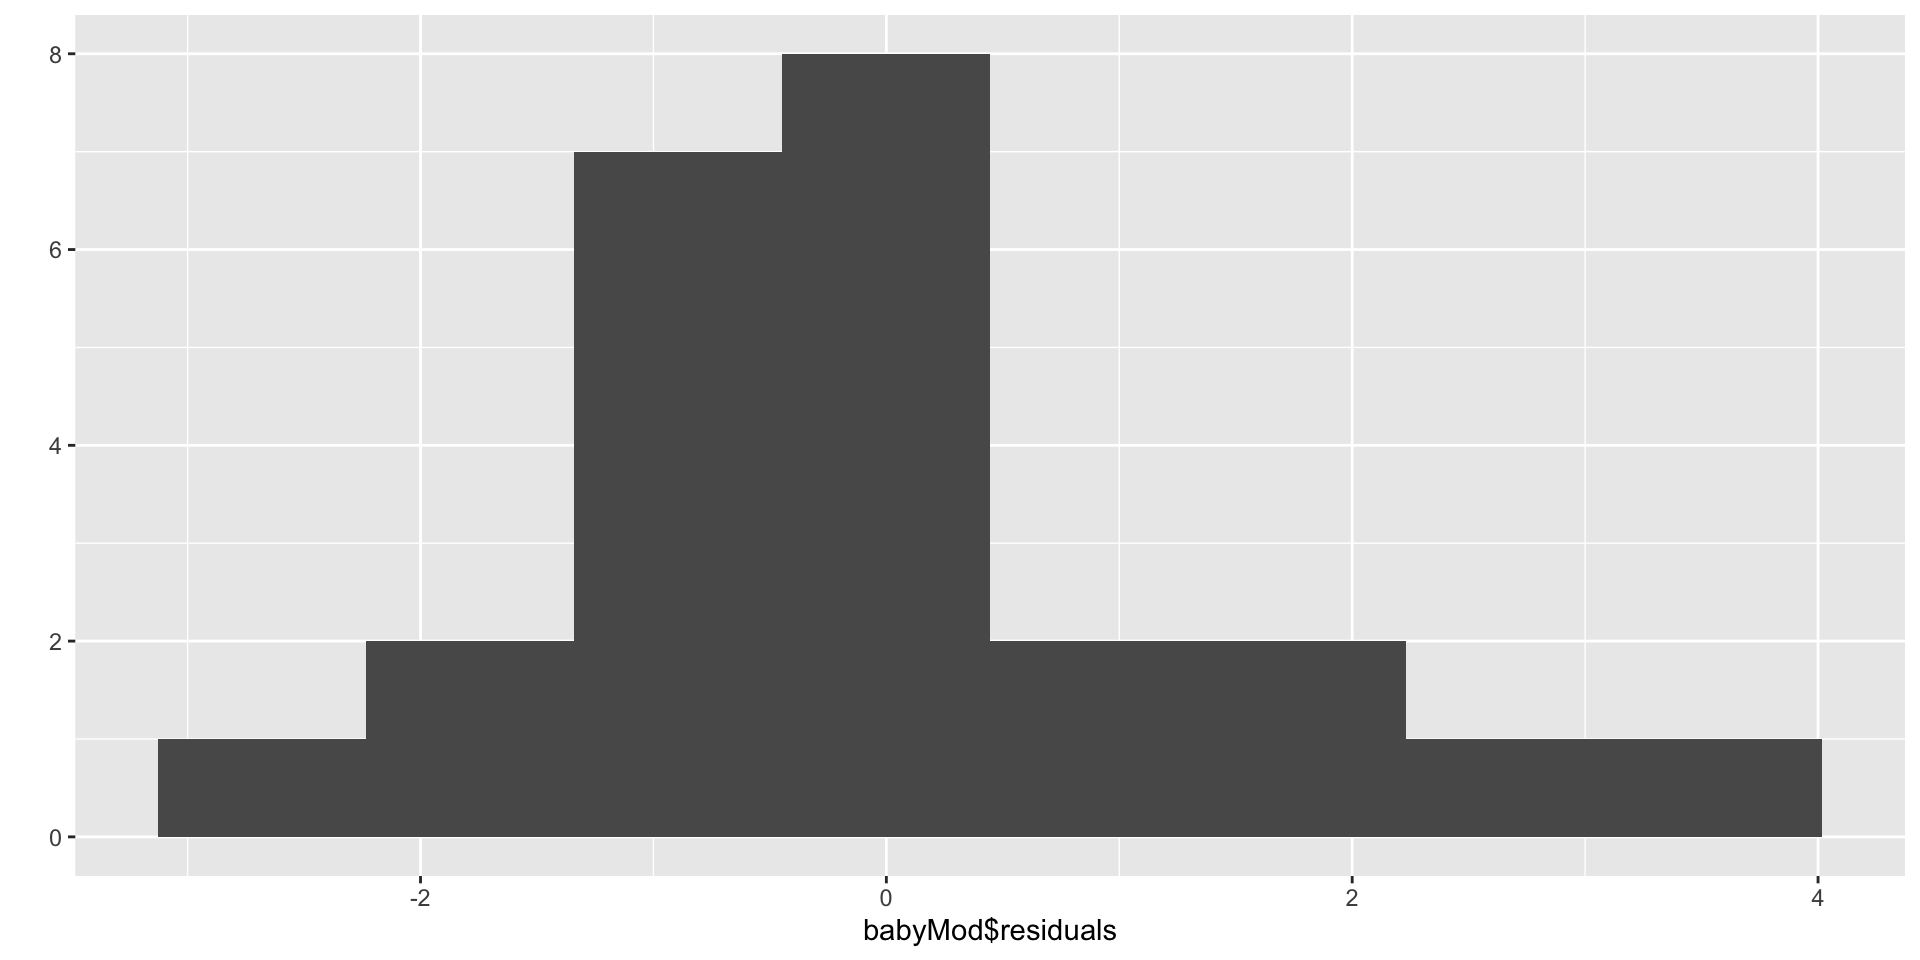
qplot(x = babyMod$residuals, bins = 8)

N: normality is satisfied; Z: Yes, centered at zero.

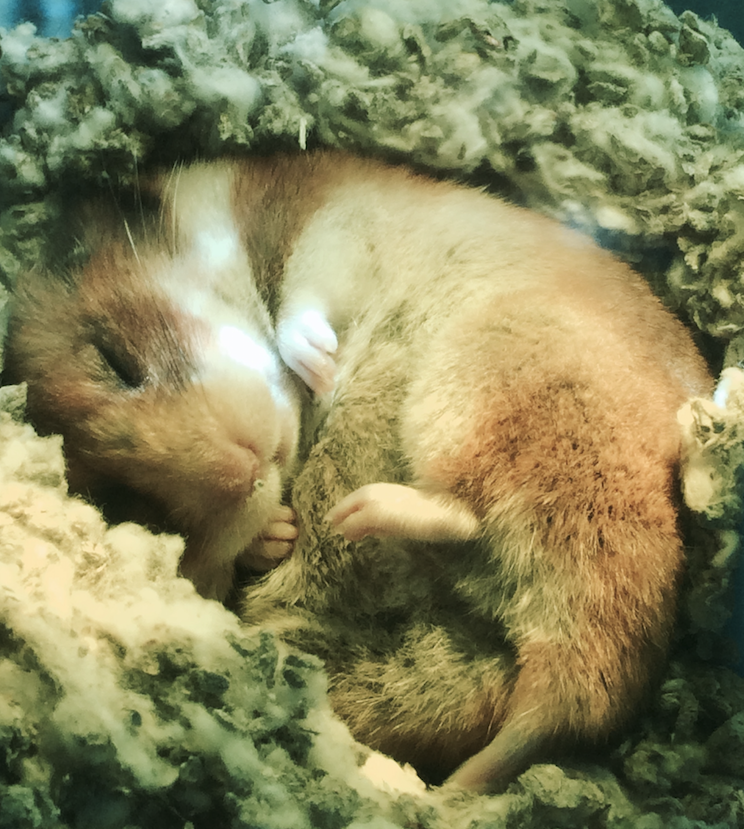
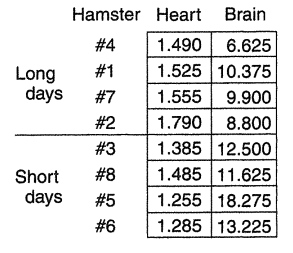
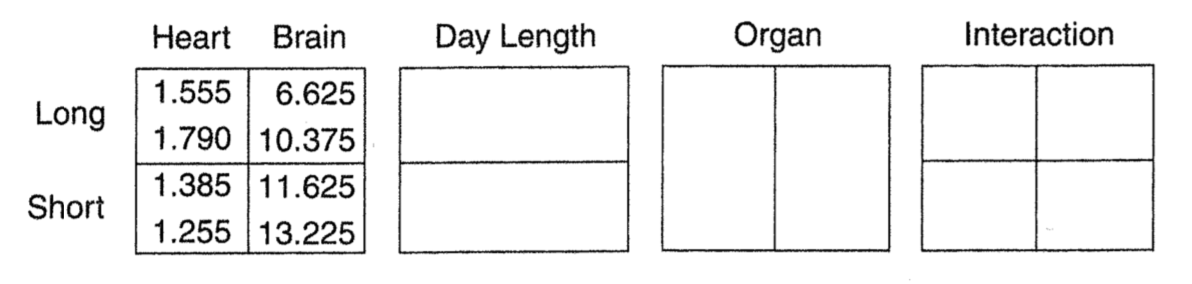
Kelly’s Hamster Study

Kelly’s Hamster Study

Design Principal 1: Random Assignment

Design 1: One-Way Randomized Design

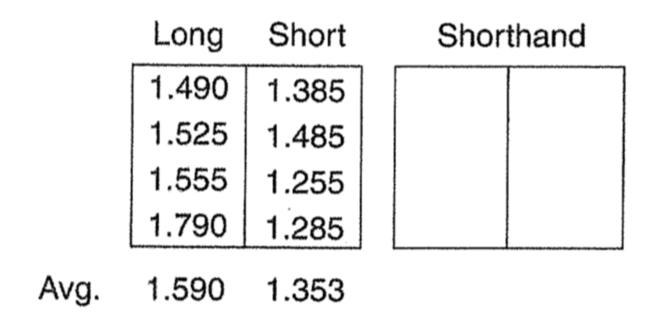
Design Principal 2: Blocking

Design 2: One-Way Complete Block Design

Design Principal 3: Factorial Crossing

Design 3: Two-Way Factorial Design

Kelly’s Hamster Study

Blocking + Random Assignment + Crossing

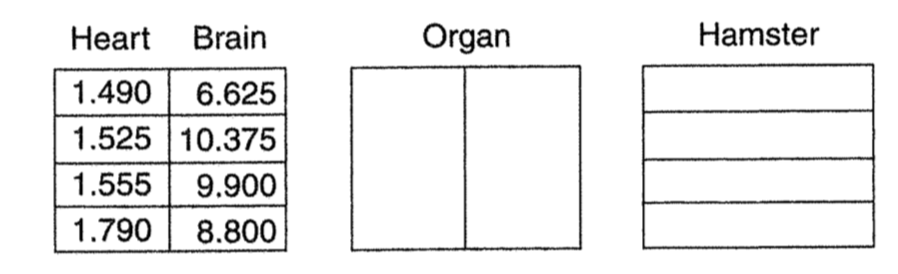
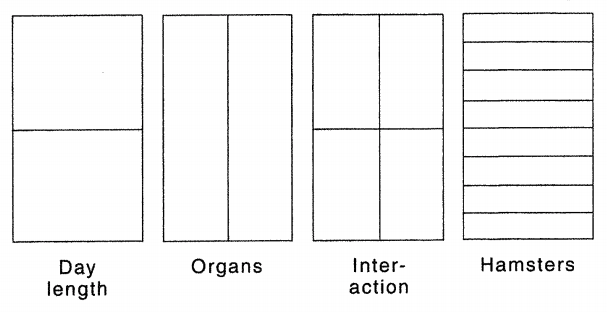
Design 4: Split Plot/Repeated Measures Design

Blocking + Random Assignment + Crossing

Design 4: Split Plot/Repeated Measures Design

Time to work on MP1

  • Log in to Qualtrics and enter your Smith credentials.
    • I usually just Google “Smith Qualtrics”