# A tibble: 2 × 3
quarantine num_responses pct
<fct> <int> <dbl>
1 against 188 0.180
2 favor 854 0.820
Response: quarantine (factor)
# A tibble: 1 × 1
stat
<dbl>
1 0.820
IMS, Ch. 16.1
2026-03-23
# A tibble: 2 × 3
quarantine num_responses pct
<fct> <int> <dbl>
1 against 188 0.180
2 favor 854 0.820
Response: quarantine (factor)
# A tibble: 1 × 1
stat
<dbl>
1 0.820
# A tibble: 1 × 2
lower_ci upper_ci
<dbl> <dbl>
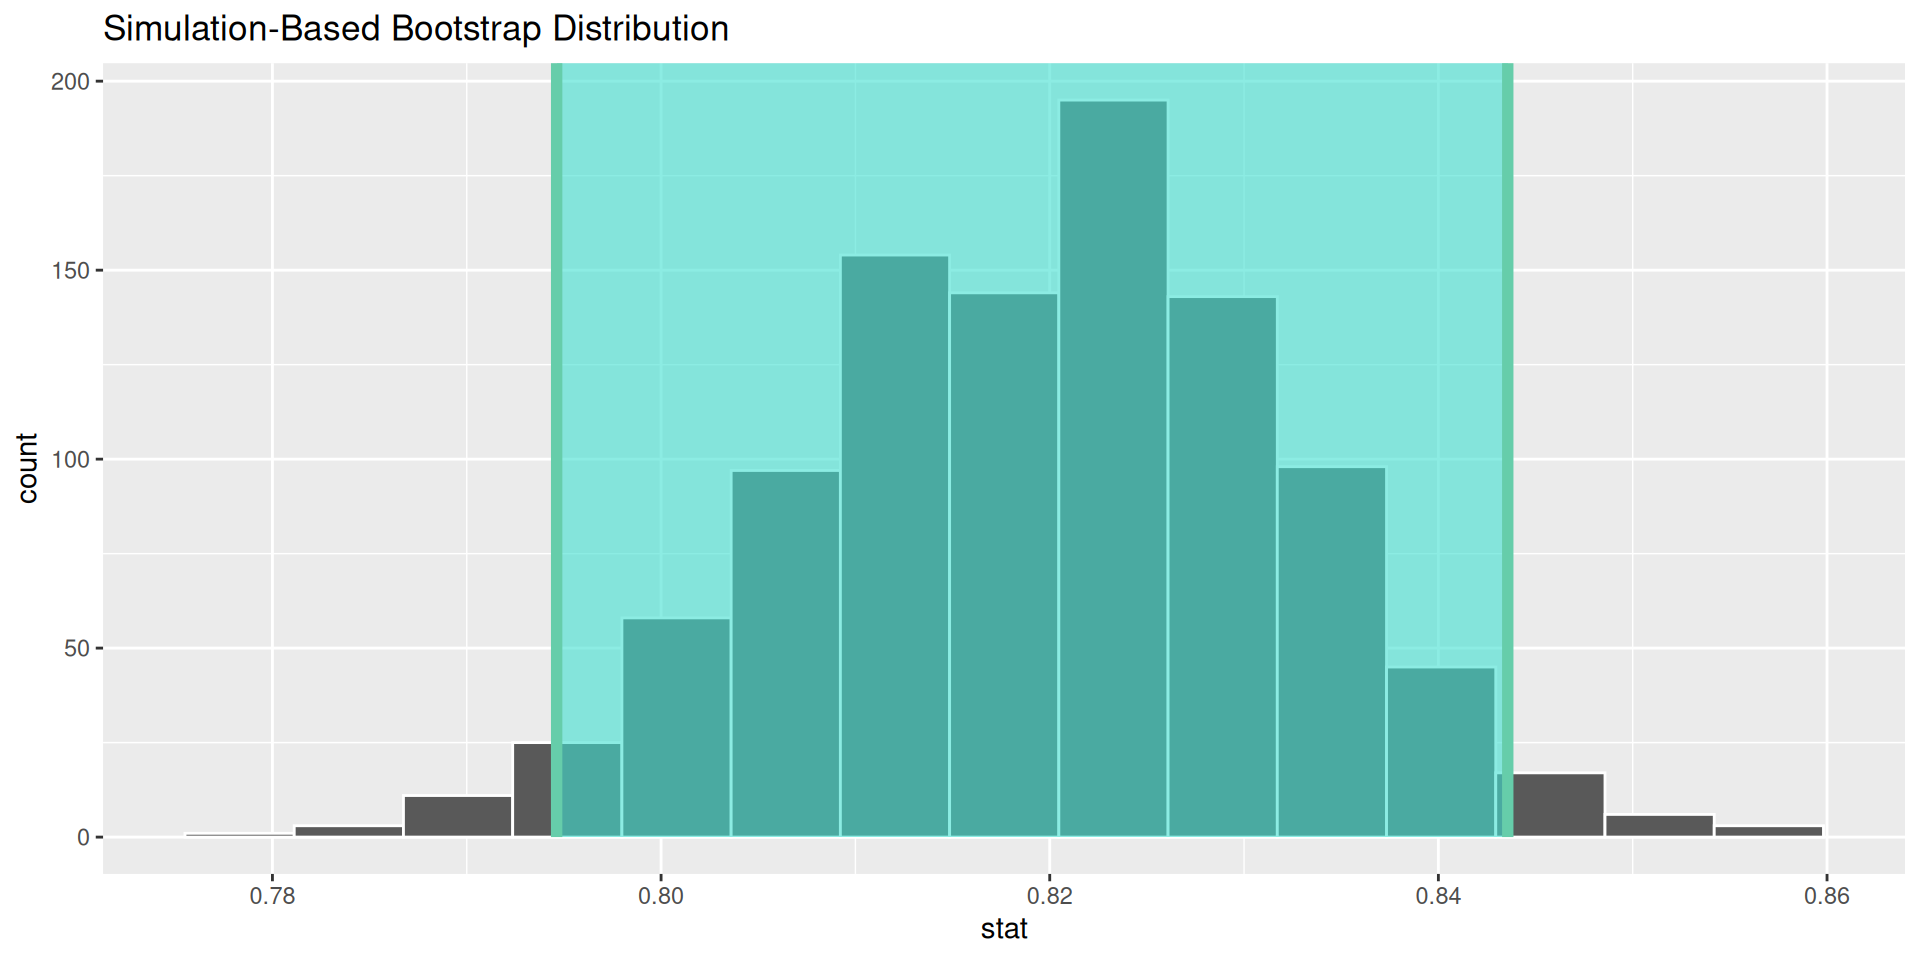
1 0.795 0.844
# A tibble: 1 × 2
lower_ci upper_ci
<dbl> <dbl>
1 0.778 0.857
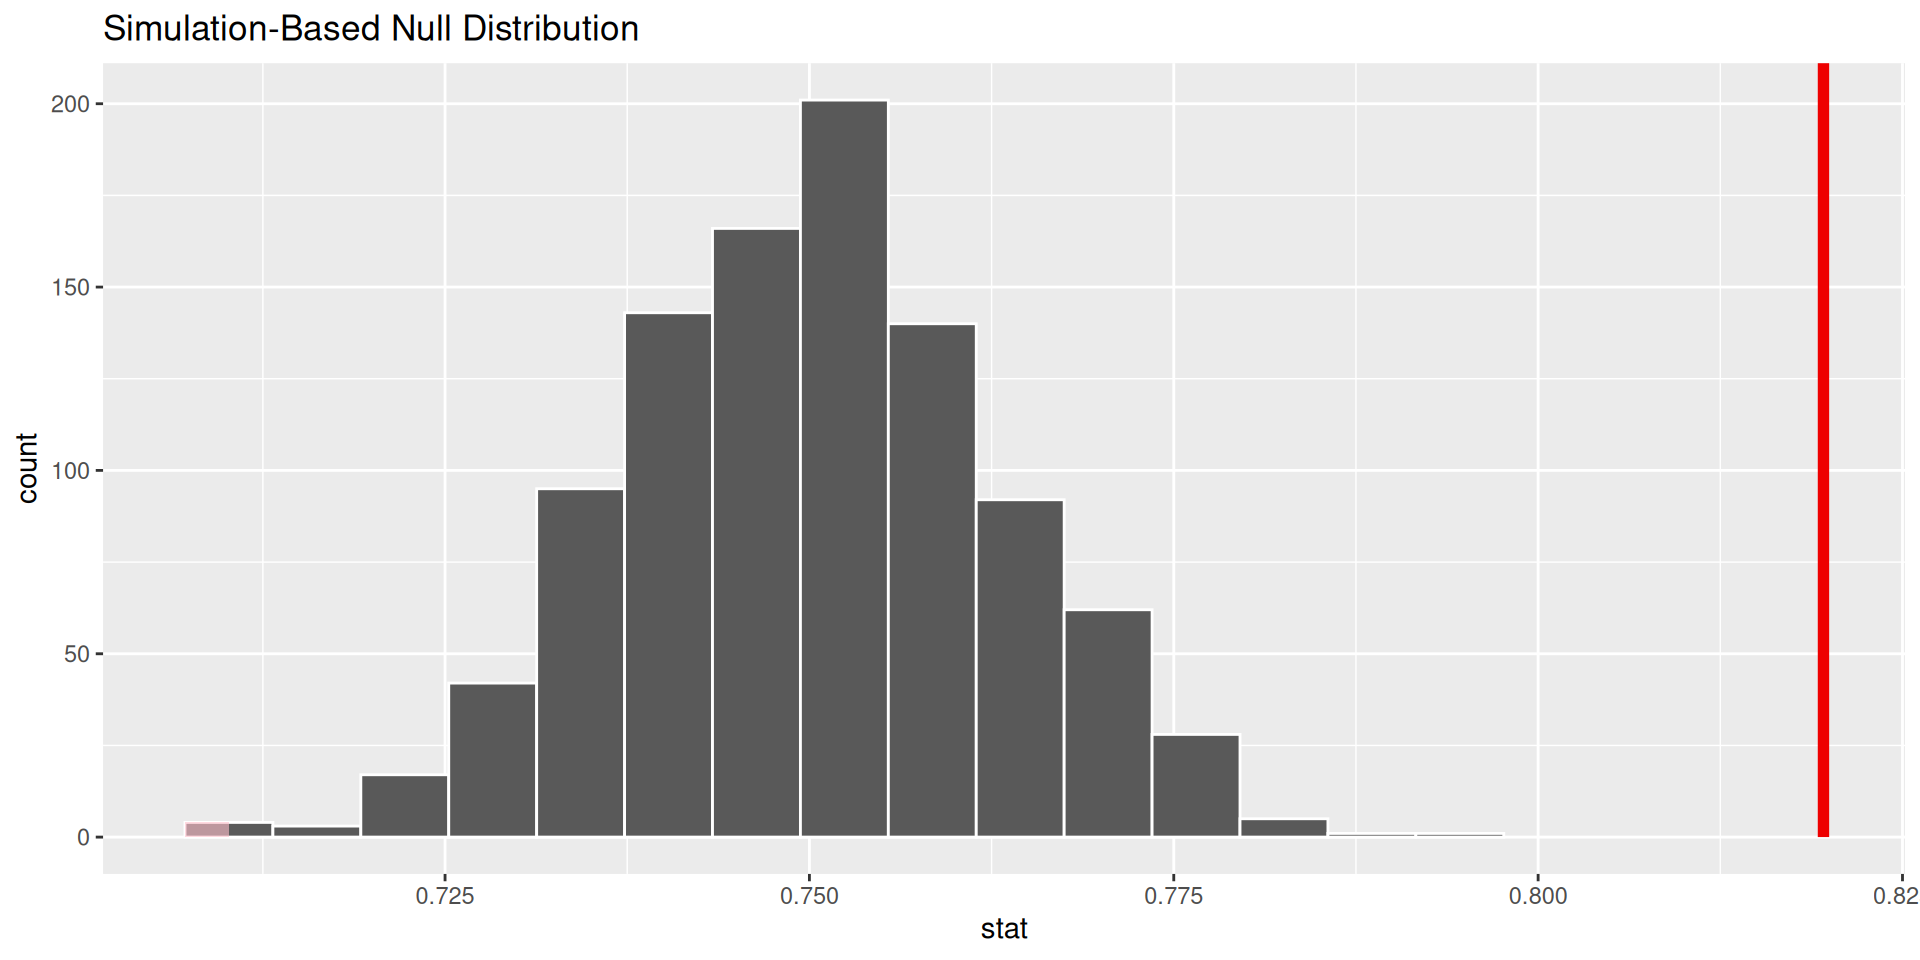
Let’s test a hypothesis:
We reject the null hypothesis that the true proportion of New Yorkers in 2014 who favored mandatory quarantine was 0.75 at the 5% level.
We conclude that more than 75% of New Yorkers favored mandatory quarantine.